Trading breakout stocks is a popular and rewarding strategy. The concept behind it is to identify a large wave of momentum and to ride it. We show traders how to find today’s breakout stocks in real time.
(Read on, or go straight to our Breakout stocks scanner.)
Being able to ride a breakout is one of the holy grails of trading. But there are several challenges.
1) How to define breakout stocks?
2) How to find breakout stocks in a timely fashion?
3) How to determine if a breakout is worth trading?
The explanation throws up more questions than answers. We’ve seen so many interpretations of this. They come in all shapes and sizes, including examples like:
Cross X% above Upper Bollinger Band
Cross X% above a moving average
X% on a technical indicator
So what is X? It could be anything from 1 to 100, depending on who is writing the formula.
These values differ among all “formula writers”. They are numbers which have been arbitrarily selected, and thrown into a system in order to make it complete.
Some of the other methods:
Drawing a horizontal line on a chart to denote resistance.
Drawing a sloping line on a chart to denote resistance.
Circling an area on the chart to denote a selling/supply zone (whatever that is).
Can you find the resistance level?

No? Maybe these will help.

All these methods are purely based on one’s discretion. They cannot be considered as scientific or consistent because they do not possess repeatable methodologies and data points.
Our solution – how we define breakout stocks
We use the 5-day range, as defined by the highest close and lowest close over the last 5 trading days.
We qualify breakout stocks when today’s price has crossed above the latest 5-day trading range by at least one standard deviation. Standard deviation is a measurement of volatility and price movement.
Standard deviation is a statistical measurement that is relevant to all price ranges, therefore eliminating the need to input an arbitrary value like X%.
The higher the standard deviation (SD), the greater the magnitude of the breakout.
Complexity made simple. And fast.
Sounds like quite a handful, doesn’t it? Well, it actually is. It requires us to process a lot of data to come up with the results.
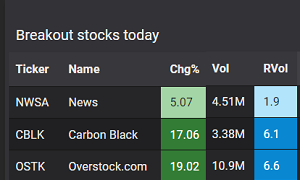
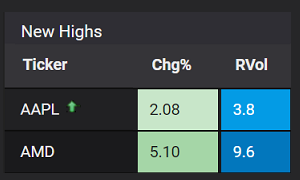
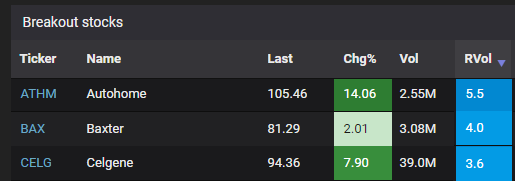
But relax, we’ve already done all the hard work so that our scanner detects breakout stocks like these:


Problem 2 – How to identify a breakout when it happens?
It’s nearly impossible to eyeball the market for breakout stocks. If you’re “eyeballing” the market, you will miss a lot of breakout stocks.
If you heard about a breakout from other people, you are getting your information much too late. If you discovered a breakout by browsing the Top Gainers or the Top Volume lists, much of the action has already happened.
Because trading breakouts are all about catching waves of momentum, the time that you identify such moves is of paramount importance.
The timeliness in which you receive your information has a direct impact on the profitability of your trades. The people that benefit most from a breakout are those that identify and move on it first.
The rewards are higher if you identify the momentum just as it occurs, or shortly after it has started. The risks are higher if you were slow in identifying the move.
Why? Because the traders that got in first will need to book their profits eventually. They will need to sell their holdings to the participants who came in later. If you were slower, that means people like you.
Our solution – the Breakout stocks scanner
Breakout stocks are usually the most salient and dramatic moves on any trading day, and they are usually the biggest themes of that day.
We created this page specifically to help traders detect stocks breaking out today in real time. You can sort the results by the various criteria that you find applicable.
Problem 3 – how to determine if a breakout is worth trading?
Are all breakout stocks tradeable? Of course not.
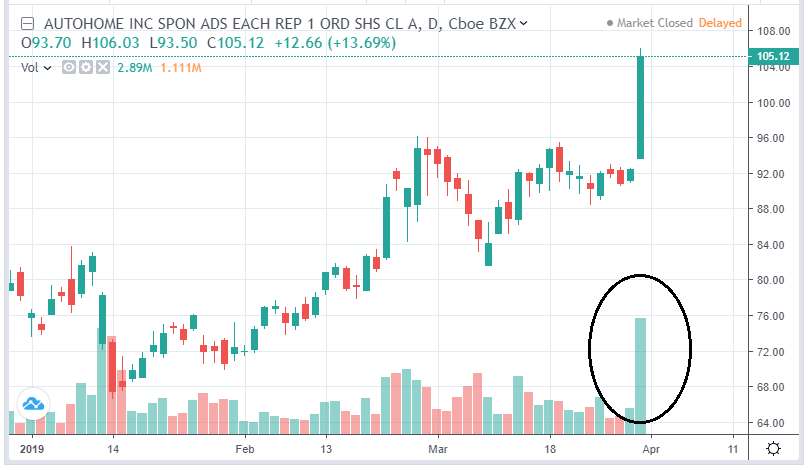
We’ve seen breakouts with low absolute volumes or low relative volumes, retrace as quickly as they started. We’ve seen technical breakouts which ultimately faded due to the absence of an actual catalyst.
Our observations from collecting the data points
The consideration of 3 factors would skew the probabilities in your favor:
1) A catalyst – this could be a recent earnings release, press release, news article, strategic review, investment, divestment, M&A event, corporate action, shareholder action, macroeconomic release, policy change, central bank announcement, governmental action, analyst upgrade, recent trading behavior or other factors.
Essentially, the presence of a reason that supports the price action. It could be something that happened today or recently.
2) High absolute volume – A high absolute volume means there are a large number of participants and a large number of transactions. It denotes interest and liquidity.
3) High relative volume – A high relative volume means that volume is out of the ordinary today. It means that something is going on today, and there are more people than usual buying up the stock. We measure relative volume and express it as the RVol ratio.
If you apply these three criteria to your trade selections, you are on your way to making higher probability breakout trades.
→ Next: How to find trending stocks in real time
About the author
David Miller is the Market Data Engineer at Stockbeep. He has spent more than two decades working across dealing rooms, market data vendors and trading ISVs.
For short term trading, David employs a data-based approach to trade equities and derivatives. For long term investing, he prefers ETFs and fixed income.
Besides helping traders find actionable information from data, he is an avid fan of hockey, golf and fishing.