Relative volume is a powerful measurement and is used to identify whether volume flows are increasing or decreasing. However, relative volume is seldom used by beginners or retail traders. The main reasons for this are:
1) It takes a while to understand.
2) It’s not widely available on retail or brokerage platforms.
3) The intraday volume distribution curve makes it hard to calculate the ratio in real time. We will discuss this afterward.
4) Improvements in computing power, data extraction, and analysis have made this calculation possible only in recent times.
(Read on, or go straight to the Unusual Volume Stocks scanner.)
What is relative volume exactly?
Relative volume is a critical measure of volume flows. It measures current volume in relation to the “usual” volume for this time of the day.
What is considered “usual”? For that, we have to use a historical baseline known as the average daily volume. That means how much volume a stock does on a daily basis over a defined period.
It is usually expressed as the 6 month, 3 month, 30 day, 10 day or 5 day average.
A 6 month average of 1 million means that the stock has traded an average of 1 million shares per day, over the last 6 months.
A 5 day average of 4 million means that the stock has traded an average of 4 million shares per day, over the last 5 days.
(Part 1/3) Relative Volume explained ….. the simple version.
Relative volume is defined by a ratio. The equation to derive the relative volume ratio is very simple.
Today’s volume / Average volume
Example 1 – Measuring against the 6 month average
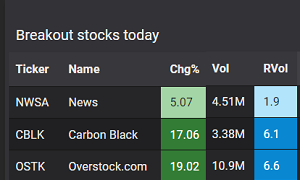
Today’s volume for AAPL is 10 million.
6 month average daily volume is 1 million.
The relative volume ratio is 10 million/1 million = 10x.
This means that for today, AAPL has traded 10 times its 6 month average daily volume.
Example 2 – Measuring against the 5 day average
Today’s volume for AAPL is 10 million.
5 day average daily volume is 4 million.
The relative volume ratio is 10 million/4 million = 2.5x.
This means that for today, AAPL has traded 2.5 times its 5 day average daily volume.
An appropriate baseline is required
As you can see, the period of the baseline changes the ratio. At Stockeep we use the 5-day average daily volume as our baseline. There are two reasons for this:
1) The more recent the data is, the more relevant it is.
2) Longer period baselines have lower volumes. This creates too much noise when we generate our results.
We use the 5 day average baseline because we want more relevance and less noise.
Ok, that was easy. Here comes the hard part.
What you’ve just read, was how to calculate relative volume based on end-of-day data. The market has already closed and the values don’t change.
That’s all right if you want to measure relative volumes after the market has closed.
(Part 2/3) Relative Volume explained ….. the intraday distribution problem
What if you needed to know relative volumes during the trading day? Can the same formula be applied? The answer is no and we show why.
Example 3 – Measuring one hour’s volume against the daily average
Using AAPL again as an example, with an average 5 day volume of 4 million.
After one hour of trading, volume at 10:30 am was 3 million shares done.
Relative volume = Current volume / Average volume = 3 million / 4 million = 0.75
The equation would give a ratio of 0.75x. You would think that the relative volume wasn’t high at all.
But wait. There’s something wrong here.
4 million is the daily average volume. A trading day has 7 hours of trading. That means AAPL usually takes 7 hours of trading to hit 4 million shares done.
Can we take one hour’s worth of volume, and compare it to a daily average which has 7 hours worth of volume?
Clearly, the answer is no. The comparison is between apples and oranges.
Definition of relative volume during the trading day
The common definition for real-time relative volume is:
Current volume for this time of day / Average volume for this time of day
However, the wording is ambiguous and prone to misinterpretation. It does not mean taking the volume from 10:30 am to 10:45 am and comparing it to what it does from 10:30 am to 10:45 am every day.
What it truly means is to compare cumulative volumes. Therefore, this is the precise definition of real-time relative volume:
Current cumulative volume up to this time of day / Average cumulative volume up to this time of day
The difficulty is in figuring out the average cumulative volume for this time of the day.
Our solution – addressing the intraday distribution of volume on stock markets
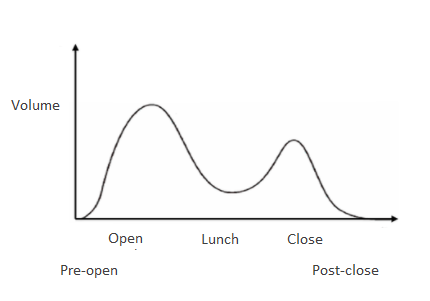
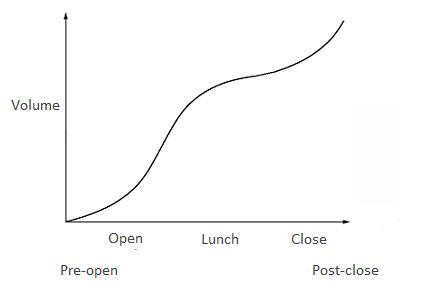
Equity markets experience higher levels of trading during two periods – the opening hour and the closing hour. The opening hour usually has more volume than the closing hour. Volumes are lowest before and after the lunch hour.
On an aggregate level, the intraday distribution of volume on equity markets looks like this:
(Part 3/3) Relative Volume explained ….. plotting the average volume against the intraday distribution curve
We now know that volumes are not equally distributed during the entire day. It peaks at the open and close, and it dips around lunch. Using this behavior, we plot intraday volume as a cumulative graph. For most stocks, this is how the volume adds up over the course of a trading day.
We take the average daily volume and distribute it into time periods according to this chart.
This means that as the time of day increases, so does our baseline for comparison. For example, in the opening hour we would use 1 million as the baseline, but for the closing hour we would use 4 million as the baseline.
Example 4 – Measuring the volume at 10:30 am against the cumulative daily average with intraday distribution
Using AAPL again as an example, with an average 5 day volume of 4 million.
After one hour of trading, volume at 10:30 am was 3 million shares done.
Based on the intraday distribution curve, the average cumulative volume for AAPL for this time of the day is 1 million.
Relative volume = Current cumulative volume for this time of day / Average cumulative volume for this time of day = 3 million / 1 million = 3
The equation would now give us a ratio of 3x. The previous calculation in Example 3 gave us a ratio of 0.75x.
This gives us a completely different picture. What we now know, is that AAPL has traded thrice its usual volume for this time of day. This means that something is going on today, and the market is unusually active with AAPL during the opening hour.
This is how we derive the RVol ratio, which tells us relative volume for this time of day.
Summary
1) Relative volume or RVol, is a ratio that calculates current volume to average volume for the same time of day.
2) Relative volume or RVol, tell us if volume flows are increasing or decreasing.
3) A high relative volume tells us that there is increased trading activity in a stock today.
4) Increased volume flows often accompany higher volatility i.e. a significant price move.
5) The equation of today’s volume over average volume is simplistic and can only be used for end-of-day analysis.
6) To calculate relative volumes in real time, the intraday distribution curve must be considered.
7) To calculate relative volumes in real time, the definition is – Current cumulative volume up to this time of day / average cumulative volume up to this time of day.
Complexity made simple. And fast.
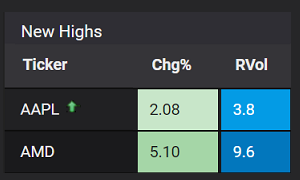
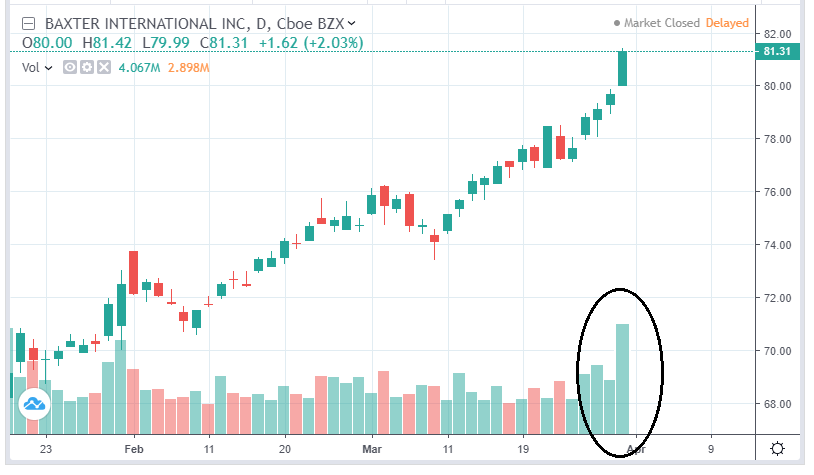
It’s been a long read and it’s quite a handful to absorb. But do sit back and relax. We’ve done all the hard work so that you can get updates when stocks do this:
→ Next: Are there trading opportunities in a bear market?
About the author
David Miller is the Market Data Engineer at Stockbeep. He has spent more than two decades working across dealing rooms, market data vendors and trading ISVs.
For short term trading, David employs a data-based approach to trade equities and derivatives. For long term investing, he prefers ETFs and fixed income.
Besides helping traders find actionable information from data, he is an avid fan of hockey, golf and fishing.