Active traders thrive on volatility and volume. The combination of the two equals opportunity. To determine which stocks to trade, traders must take these two factors into consideration. We examine how traders find stocks to trade using conventional methods and stock scanners.
The Most Active/Top Volume list is a common way to see what is being actively traded today. It is simply a ranking of the stocks with the most shares traded thus far for today. While it is commonly referenced, there are a few disadvantages with this list:
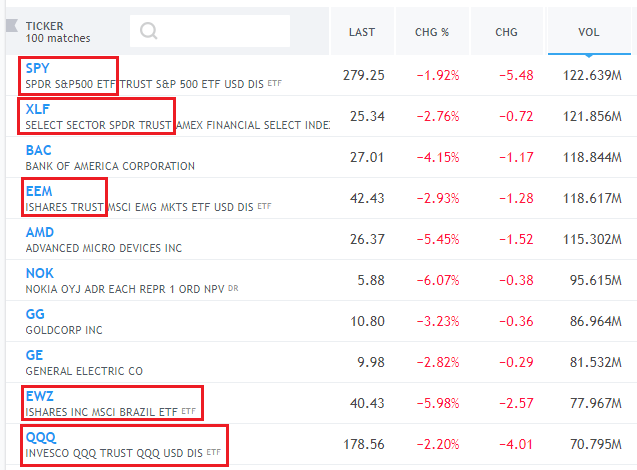
1) The rise of ETFs means that ETFs always feature in this list. If you are looking to trade specific individual stocks, this list has little benefit to you.
2) Certain stocks frequently appear in this list due to the size of their free floats, market capitalization, and institutional interest. As we can see here, any stock that has an average daily volume of 70 million shares, frequently appears in this list.
3) Results on this list appear after the fact. That means that the stock has already transacted a large amount of volume before it qualified for the list. Information that is after the fact, is considered stale by traders.
Traders are more interested to know about volume flows as they happen, not after.
4) Top volume does not mean unusual volume. Traders are more concerned with unusually high volume (or high relative volume).
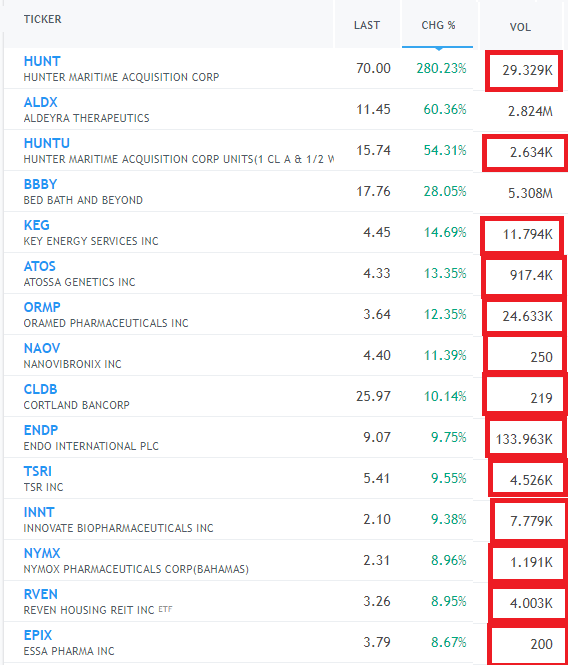
Two problems are common to this list. Cheap stocks dominate this list because a single tick move in a cheap stock equates to a large percentage move.
Low volumes often plague this list, as seen here. We’ve highlighted all the stocks with less than 1 million shares in volume.
High percentage gainers often lack meaningful price action and liquidity. Although this list displays dramatic percentage changes, in reality, it offers very little trading opportunities.
Most Active and Top Gainers – do traders still use them?
The conventional Top Volume and Top Gainer lists are heavily referenced by retail traders and the public. However, the design and logic behind these lists have not been updated in decades.
We’ve long held the opinion that these lists are inherently flawed and do not highlight the real trading opportunities in the market.
Professional traders have long moved away from this method of assessing the market. Instead, there are now various platforms that allow a trader to build his own ranking lists, according to his own criteria of stocks to trade.
Such platforms are called stock scanners or market scanners, like the free stock scanner that we have built here at Stockbeep.
So what do traders really look out for?
1) Liquidity – This means being able to enter and exit a position, with as little delay, difficulty, and slippage as possible.
At Stockeep, we measure the top 1000 most actively traded stocks across NYSE, Nasdaq, and AMEX. Most of the stocks in our watchlist have a minimum daily average volume of at least 1 million shares.
2) Price action – traders are looking for price action which shows that the stock is clearly moving up, or down. Typically, these would entail:
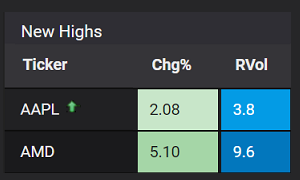
2a) Price making new highs and establishing a new price range. Examples of these would be 52 week high stocks, as well as those reaching monthly highs.
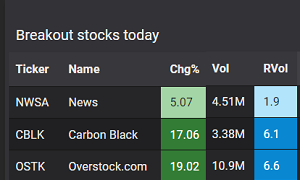
2b) Price moving beyond an established resistance, also known as breakout stocks.
2c) Price moving consistently in an upwards direction, also known as trending stocks.
2d) Price moving consistently in an downwards direction, also known as downtrend stocks.
3) Volume flows – traders look for 2 kinds of volume flows:
3a) Instantaneous volume. This is the number of shares being traded right now. Traders watch for stocks with high instantaneous volume because these stocks tend to bring about short-term intraday price action.
3b) Unusual volume stocks or stocks with a high relative volume (RVol) ratio today. This is the ratio of today’s volume compared to its average levels. Traders watch for stocks trading on high relative volume because it signifies that the stock is in play today. An elevated RVol tends to bring about greater price action. Stocks with high relative volumes are also called “volume spikes”.
Summary
The conventional lists of Most Active and Top Gainers give some insight into market activity. However, on their own, they are not enough to generate ideas for stocks to trade.
Traders seek definitive price action and elevated volume flows. Therefore, traders use stock scanners and market scanners, to detect these two elements.
David Miller is the Market Data Engineer at Stockbeep. He has spent more than two decades working across dealing rooms, market data vendors and trading ISVs.
For short term trading, David employs a data-based approach to trade equities and derivatives. For long term investing, he prefers ETFs and fixed income.
Besides helping traders find actionable information from data, he is an avid fan of hockey, golf and fishing.