Unusual volume stocks are often characterized by volume spikes. The correct terminology for a volume spike is “high relative volume”. In our previous article, we highlighted the importance of using high relative volume in stock trading.
(Read on, or go straight to the Unusual Volume Stocks scanner.)
A volume spike signifies that today’s trading activity is out of the ordinary, which implies that something significant is happening today.
Large moves in the stock market are often accompanied by a volume spike. Here’s an example:
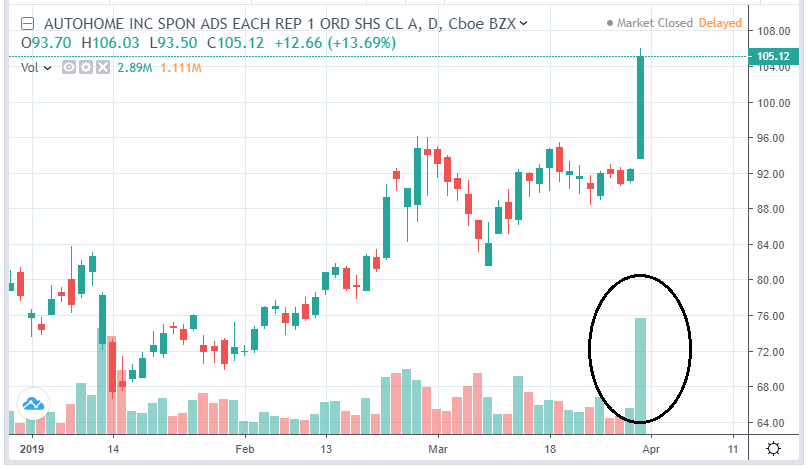
Tip: Increased volume flows are correlated to increased volatility. To traders, that means opportunity.
Why volume spikes are hard to detect
Volume spikes are hard to detect unless you are actually staring at the chart. Let us examine the most conventional tool used by the public – the Top Volume list.
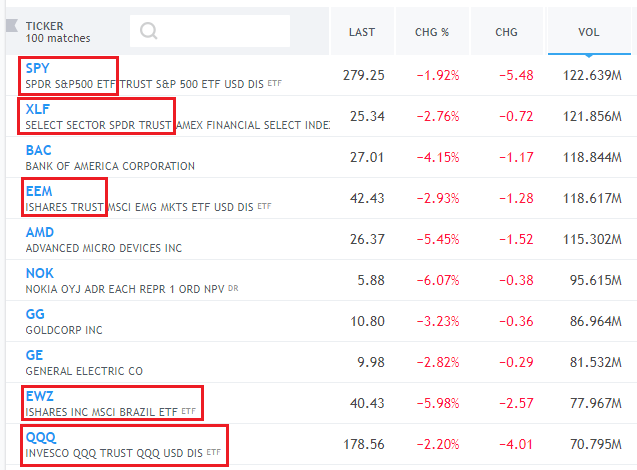
There is no information here to indicate which of these stocks, if any at all, are experiencing a volume spike. The Top Volume list simply ranks stocks by absolute volume and does not measure relative volume.
There are only two ways to know if a volume spike has occurred within this list.
1) You have intimate knowledge of the average volume levels for each stock.
2) You open the chart for each stock to check if there is unusually high volume.
Most likely, it will be the latter. You would need to open every chart, visually inspect the volume and make a subjective call if there is unusually high volume today.
Even if you do discover a volume spike this way, there is an additional problem. Top Volume lists are after the fact. This means that if you discover a volume spike through this method, you are looking at volume flows that have already happened.
Limitations of available tools
You could discover a volume spike using a scanner. Some do measure relative volumes. However, many free scanners are usually end-of-day scanners. Which means you can only spot a volume spike after the market has closed.
That’s not particularly useful if you intend to identify and capitalize on the volume spike during the trading day.
Some retail or brokerage platforms have intraday scanners built into them. There are 2 main problems with these:
1) Frequency – Some are set to refresh every few minutes or even slower. At Stockbeep, we crunch price and volume data every second.
2) They are not time-sensitive because they measure current volume against the entire daily average volume. That is a simplistic method which does not account for the intraday distribution curve.
Intraday distribution and the cumulative volume curve will be discussed in our next post.
Our solution – real-time measurements on increased volume flows
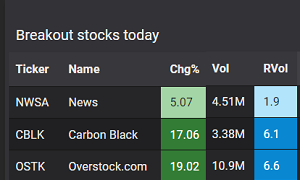
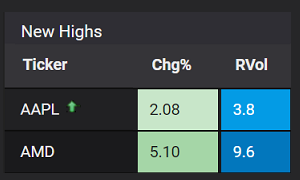
At Stockbeep we measure relative volume levels in real time. Our relative volume (RVol) values are used every day by market watchers to identify unusual trading activity as it happens.

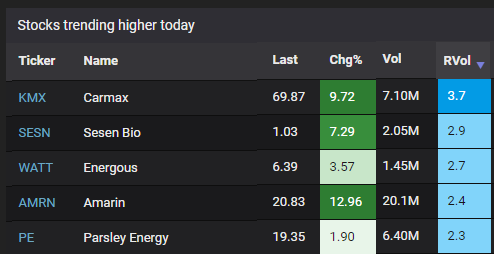
We measure the relative volume on all the stocks in our coverage. Sorting by RVol lets you rank the results by the magnitude of volume change. This allows you to know what the market is buying or selling today, on unusually high volume.
2 specific pages dedicated to volume spikes
We have the Unusual Volume stocks scanner, which detects stocks moving up on increased volume today. If you’re looking to trade on the down side, we also have the Unusual Volume losers page, which tracks stocks going down on unusually high volume.
Summary
1) Volume spikes or high relative volume, indicate unusual trading activity today. These often present meaningful trading opportunities.
2) There are limited ways to identify volume spikes using conventional tools like the Top Volume list.
3) The measurement of relative volume needs to take into account the current time of day, and the intraday volume distribution curve. Most available tools do not do this.
4) Stockbeep solves this problem by using our real-time methodology with our relative volume (RVol) scans.
→ Next: How to calculate relative volume for intraday trading
About the author
David Miller is the Market Data Engineer at Stockbeep. He has spent more than two decades working across dealing rooms, market data vendors and trading ISVs.
For short term trading, David employs a data-based approach to trade equities and derivatives. For long term investing, he prefers ETFs and fixed income.
Besides helping traders find actionable information from data, he is an avid fan of hockey, golf and fishing.