The 52 week high is the highest price that a stock has achieved over the past year. It is different from the all time high, which is the highest price achieved since the IPO date, a period which could span years and decades. The all time high is also known as the lifetime high.
(Read on, or go straight to the 52 week high stock scanner here.)
Importance
There is widespread use of the 52-week high as a reference point. This is because the 52-week high is perceived as the long-term resistance level.
You can find it being featured across multiple stock scanners, websites, and trading platforms.
Many automated/algorithmic traders have also incorporated 52 week highs as part of their strategies. They often scan for stocks that are approaching or making new 52 week highs.
Stocks trading at these levels are considered to be on a confirmed long-term uptrend, having risen steadily over the past year. When a stock trades at such price levels, it typically denotes healthy investor demand on a company with improved or positive fundamentals.
Usage of the 52 week high as a trading signal
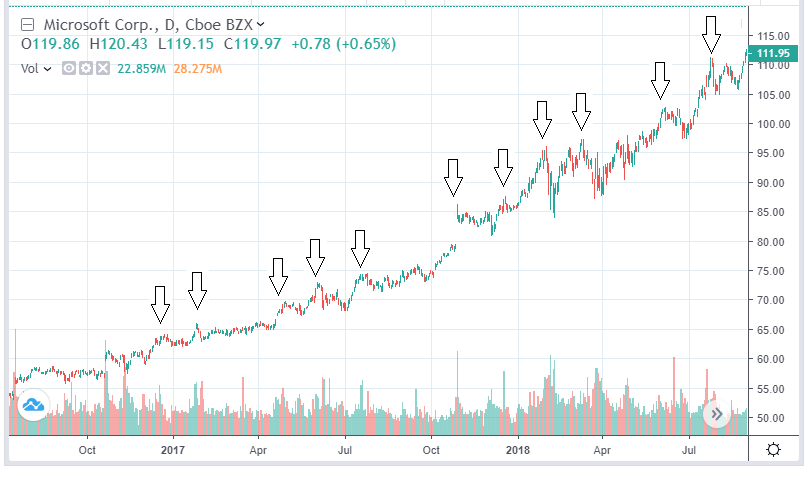
When a stock makes a new 52 week high, momentum traders and trend followers are likely to view the event as a bullish signal. For such traders, their belief is that stocks which are going higher, will continue to go higher.
A stock that has made a new 52 week high, could continue to make many more new highs. Some stocks do trend higher for years, making numerous new highs in the process.
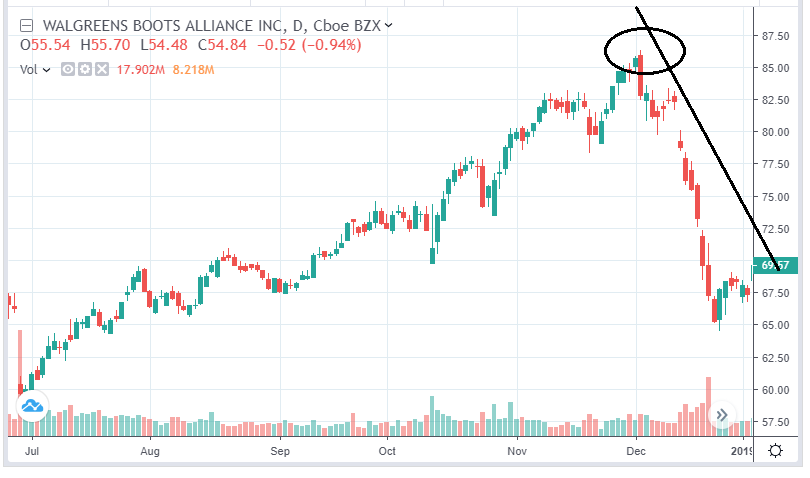
For contrarian traders, the philosophy is “what goes up must come down”. The 52 week high is considered an entry signal to short the stock. To them, the stock has run up too much, and is due to fall back to “fair value”, also known as “reversion to the mean”.
Is the 52 week high a valid signal?
Yes, in the sense that you should take notice of it, but not in the sense that you should immediately initiate a long or short position. You should always consider the context surrounding the stock, and understand the catalysts driving the stock. What are the tangible reasons behind the investor demand?
Has the company announced a new product or patent?
Was there a surge in earnings?
Has there been a buyout offer?
Did the company announce a restructuring plan that the market was hoping for?
Has the company recorded growth in new markets or segments?
Was there a recent regulatory development, for e.g. an FDA approval?
Has there been a recent victory on litigation and legal issues?
Was the stock included into a major index?
Have trading volumes been rising or falling?
An analysis of such background factors, can help determine whether investor demand will rise or fall in the near future. If investor demand continues or increases, the stock could maintain its upward trajectory. If investor demand stagnates or decreases, the stock could retrace, leading to a failed 52 week breakout.
Consider the holding timeframe of your trade
Stock prices will oscillate even if the general long-term direction is upwards. In other words, even if the stock is on uptrend, the price will still move up and down in the process.
Are you a short-term options trader with tight stops? If so, you could be hoping to take advantage of the short term retracements and cyclical moves.
Or are you an investor who believes in the long-term potential of the company? If so, you may have wider loss limits and greater tolerance of short-term fluctuations.
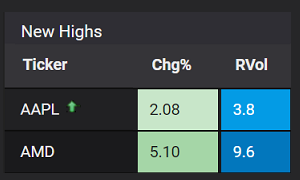
How Stockbeep tracks stocks making new highs
Our 52 week high stock scanner, is focussed on stocks making new highs. We track the lifetime high, 52 week high and monthly highs.
We include monthly highs because traders demand knowledge of these price levels too. It is logical and sequential, that a stock would make an 11th month high, on its way to a 52 week high.

We also track a stock when it is approaching the 52 week high. This is when the stock has made a daily high AND if that daily high is approaching the 52 week high.
Summary
The 52 week high is a reference point that is widely used by all sorts of traders.
Trend followers and momentum traders view a new 52 week high as a bullish signal.
Contrarian traders view 52 week high stocks as overbought and due for a correction.
You should not blindly use a new 52 week high, as a signal to go long or short.
You should firstly, and always, understand the context surrounding the stock when it has made a new 52 week high.
Consider the timeframe of your trade. Are you attempting to profit from a short-term retracement, or do you have a bullish long-term view of the company’s prospects?
Stockbeep tracks multiple period highs, including the all time high, 52 week high and monthly high. We also track stocks that are approaching the 52 week level. The scan is available here at our 52 week high stock scanner.
→ Next: How to find gap up stocks in real time
About the author
David Miller is the Market Data Engineer at Stockbeep. He has spent more than two decades working across dealing rooms, market data vendors and trading ISVs.
For short term trading, David employs a data-based approach to trade equities and derivatives. For long term investing, he prefers ETFs and fixed income.
Besides helping traders find actionable information from data, he is an avid fan of hockey, golf and fishing.