Stock markets are notorious for having a low signal-to-noise ratio. The New York Stock Exchange (NYSE) alone produces petabytes of data every day. Stock markets produce a lot of data, but most of it is background noise. The role of stock scanners is to help market participants find meaningful and actionable information from the mountain of raw data.
(Read on, or go straight to our free stock scanner to find what’s moving in the stock market today.)
Who uses stock scanners?
There are different kinds of stock scanners because there are different kinds of market participants. Firstly, you need to decide what kind of market participant you are. Are you a trader or a long-term investor?
Fundamental scanners for investors
If you are an investor, a fundamental scanner is more suited for you. Such scanners store data related to the financial performance of the company, which is also known as fundamental data.
Fundamental scanners help you to filter investment candidates using various financial metrics, including but not limited to:
P/E ratio
Price to book value
Earnings history
Revenue history
Dividend history
Debt ratios
Asset values
Cashflow ratios
Because companies release financial data every few months, these metrics do not change often, making fundamental scanners suitable for an investor with a longer-term view.
Price and volume scanners for traders and broker/dealers
If you are a trader or a market professional, you need to know what’s moving in the stock market today. You need a scanner that is designed for measuring today’s price and volume. These data points would be more relevant to you:
Last
Open
High
Low
Change
Change%
Volume
This dataset of today’s price and volume is also known as primary data. We will expand on that later on. Such stock scanners help to increase your awareness of today’s market, with the end goal being to discover short-to-medium trading opportunities.
Identify price action and volume flows
Sometimes the market feels like it’s doing nothing. Your watchlist has barely moved and the indices are flat.
We’ve been to many dealing, brokerage, and trading venues, and this scene actually happens very often in real life.
However, your watchlist does not represent the entire market, and it does not mean that volatility is absent from the entire market. You simply need a tool to identify where the volatility is.
Stock scanners help market participants identify price action and volume flows that are happening beyond their watchlist.
Limitations of many stock scanners
1) A blank – most stock scanners start with an empty slate. The user is expected to know how to crunch the data. He is expected to select certain fields and input some arbitrary values which he feels are suitable for him, for example:
– “Find me stocks that are up by at least 3% today.”
– “Display stocks that are have traded at least 1 million shares today.”
We’ve seen that most users don’t fully maximize the potential of scanners, because of its inherent design where the user has to start from scratch. Most traders would prefer to have pre-configured screens that have already established the filtering criteria.
2) Limited dataset – most stock scanners enable the user to filter and sort using primary data only. Primary data is today’s Last, Open, High, Low, Close, Volume, Change, and Change%.
Ultimately, primary data produces little intelligence on its own. You could say “find me stocks up at least 3% today with a volume of at least 1 million shares.”
In essence, all you’re doing is extracting a truncated version of the Top Gainers list, with a minimum volume threshold thrown in.
3) Lack of secondary and historical data – meaningful analysis can only happen when primary data is juxtaposed against historical and secondary data.
Secondary data would include details like 5-day % change, period highs, period lows, average volumes, standard deviations, support and resistance levels.
Secondary data is constructed from historical data and has many permutations, but the ones listed above are the most commonly referenced points.
Our solution – a simpler, intuitive and comprehensive stock scanner
1) In order to identify meaningful price action and volume flows, we measure today’s primary data against secondary data.

In this example, by comparing today’s data with secondary data, we were able to spot MLCO experiencing a price breakout on unusually high volume.
2) Pre-configured trader-centric lists. We’ve been conducting market data analytics for a long time, and we know the price action that traders look out for.
That is why we have created pre-configured screens for each category, without requiring the user to create his own screens. They are instantly accessible with a click of a mouse:
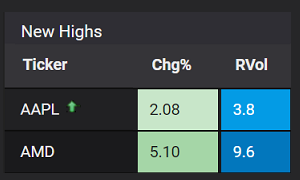
52 week high stock scanner
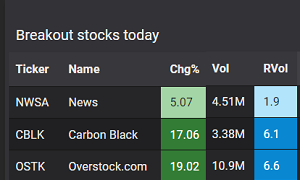
Breakout stocks
Trending stocks
Gap up stocks
Unusual volume stocks
Stocks moving up now
Summary
1) Stock scanners help to sift through the mountain of market data.
2) Stock scanners are designed to help find meaningful and actionable information.
3) Fundamental scanners are more suited for long-term investors, while price and volume scanners are more suited for traders and market professionals.
4) Many stock scanners require a user to build his own screen from scratch.
5) Many stock scanners only display primary data and do not access secondary data.
6) Stockbeep measures primary data against secondary data, and organizes that information into pre-configured trader-centric lists.
→ Next: How to determine which stocks to buy
About the author
David Miller is the Market Data Engineer at Stockbeep. He has spent more than two decades working across dealing rooms, market data vendors and trading ISVs.
For short term trading, David employs a data-based approach to trade equities and derivatives. For long term investing, he prefers ETFs and fixed income.
Besides helping traders find actionable information from data, he is an avid fan of hockey, golf and fishing.